The research and testing of LED lighting systems has led to the establishment and certification of specific lighting testing laboratories
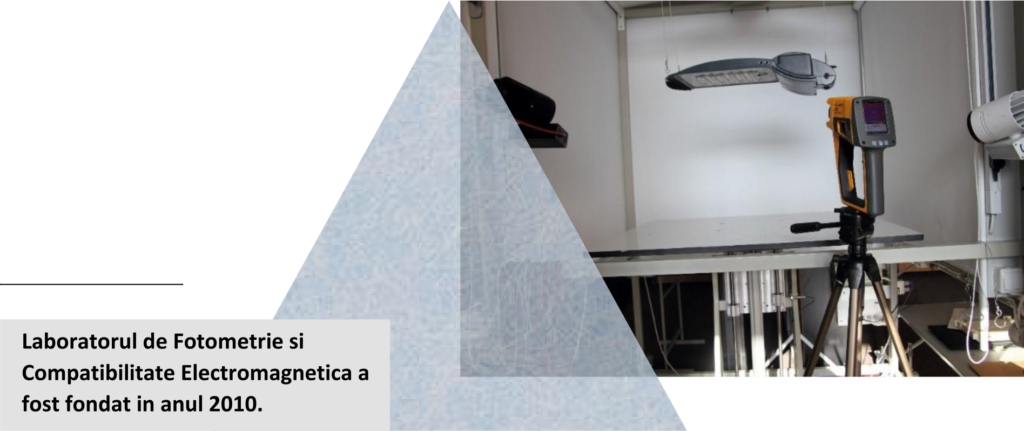
The laboratory also has expertise in the design, construction and characterization of lighting systems for all applications. It also studies Solid-State LED lighting or OLED lighting productions, starting with the development stage and ending with implementing in practice, for scientific and educational purposes.
Laboratory also performs research in the field of special materials such as thermoconductive polymers.
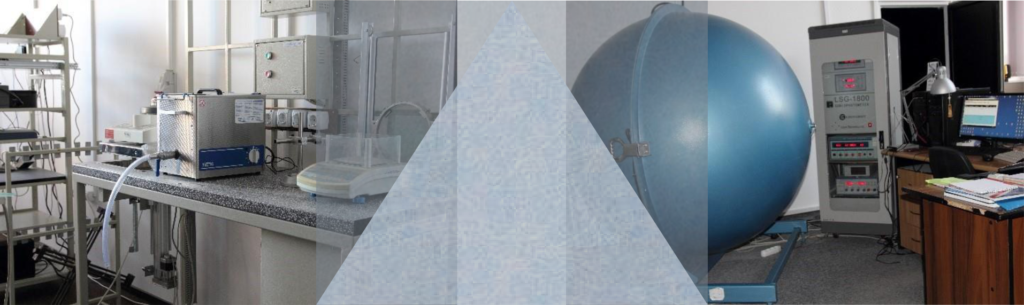
Photometry
The evaluation of the performance of the lighting devices provides both the designers and the beneficiaries with the necessary information for an adequate selection of the performances of the system suitable for the use.
We measure any light source up to 1000 W and ensure the highest accuracy: Our measurement uncertainty (k=2) is depending on the light source, maximum 5%.

Measurement of the relative spectral power distribution P (λ), chromatic coordinates ,correlated colour temperature, colour rendering index, colour coordinate difference.
• Wavelength range: 380nm ~ 780nm,
• Precision wavelength: ± 0.2 nm
• Repeatability wavelength measurement: ± 0.1nm
• Precision trichromatic coordinates: ± 0.0003 (A type illuminant calibration)
• Spectrum sampling: 1nm or 5 nm
• Illuminance linearity: 0.3%
• Illuminance precision: class 1
• Correlated Color Temperature Range: 1500K ~ 25000K
• CT precision: ± 0.3% (A type illuminant calibration)
• Color rendering index accuracy: ± (0.3% ± 0.3)


Automatic goniophotometric measurement system according to specific light distribution measurement standards. The IES file format meets the requirements of the lighting design process. Spatial light intensity distribution curve in Cartesian polar coordinates, visualization of spatial intensity distribution, isolux representation, isocandela distribution, luminous efficacy, equivalent angle of the luminous beam, ratio of upward luminous flux, ratio of downward luminous flux total luminous flux, efficacy, factor of use.

• Measurement type, B-β și C-γ
• Temperature compensated precision photometric detector: V (λ) correction, CIE-F1 is less than 0.015
• Illuminance sensitivity: 0.00001 lx
• The measurement results are processed according to international standards and can be used in the design process compatible with simulation software such as Dialux or Relux
• Angle precision: 0.1°
• Angle resolution: 0.002°
• Meets IEC, CIE and IESNA standards

Thermal analisys
 Thermal management is a critical issue in LED lighting. Quality management ensures a low light degradation, quantum efficiency and colour stability.
An efficient thermal management removes the heat generated by the LED structures.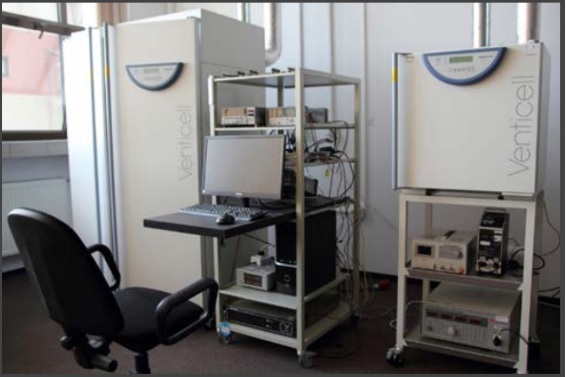
Measurement of junction temperature and thermal resistance by the electrical method
Measuring the temperature of the LED support with a thermocouple and estimating the junction temperature using the thermistor provided by the manufacturer.
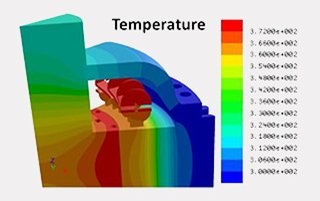
Measuring temperature and temperature distribution with the IR camera.
 The small size of the LED and its surrounding makes it difficult to measure the junction temperature by direct methods, such as thermocouples and infrared cameras. Fortunately, this can be measured indirectly using the inherent voltage / temperature dependence of the LED junction, with a technique specified by the JEDEC
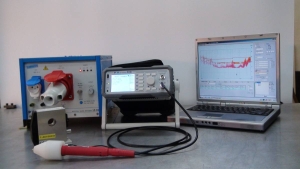
- Programmable current pulse source with 0.1% accuracy, 5A/10 μSec max 100V
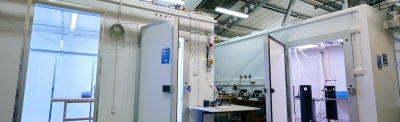
- Temperature controlled enclosure with temperature gradient <0.1 °C
- Graphic representation of temperature variations
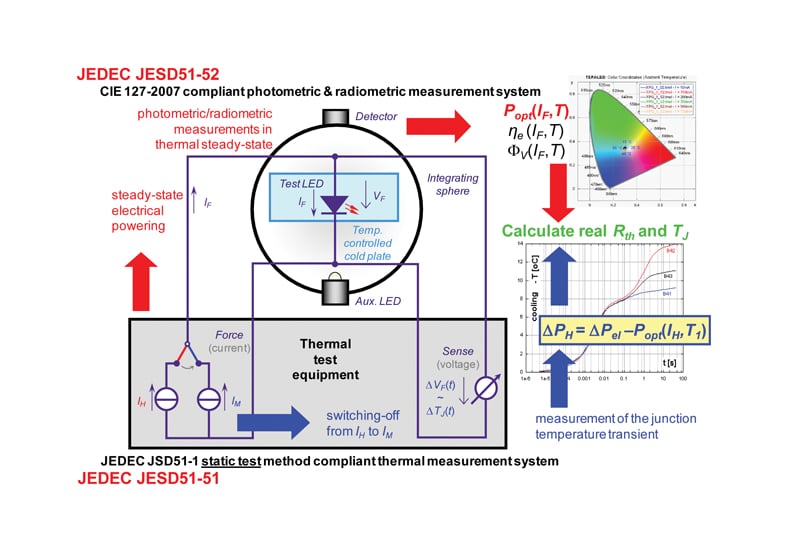 Automatic junction temperature measurement system in accordance with IEDEC JESD51-1 described as an electrical test method.
Industry standard measurement technique based on variation of forward junction voltage with temperature.
This method uses at least two current values of a diode’s Vf/Temperature characteristic: a low measurement current right at the conduction entrance and a much larger current that produces junction heating.
EMC
 EMC testing confirm that the currents emission from the light fittings do not disturb commodity’s’ normal working and also they are not affected by others from same environment.
Self-scanning system composed of Receiver, Artificial Network, CDN and Precision AC Power Supply.
Average (AV) and Quasi-Peak (QP)
Frequency range: 9 kHz – 30 MHz and 30 MHz – 300 MHz
Measurement type: Conducted disturbance voltage (and CDN method).
 A common concern in lighting is to keep THD (total harmonic distortion) at a lower level. The power supplies are nonlinear loads and therefore disturb the sinwave by introducing harmonics. These harmonics can cause interference in the operation of other electronic systems. Therefore, it is important to measure the total effect of these harmonics. Total harmonic distortion gives us information about the harmonic content in signal with fundamental component. Higher THD means larger distortions on the input network or lower power quality.
Determination of harmonic current emissions of electrical equipment, according to SR EN 61000-3-2:2014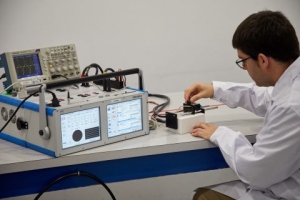
- Range
- Voltage:10-600V
- Current: 0.01-20A
- PF: 0-1
- Power: 0-9999
- Frequency 45-65 Hz
- Measurement uncertainty
- Harmonics 1-39 : 6%
- Power: 0.8% Programmable current pulse source with 0.1% accuracy, 5A/10μSec, max 100V
-
- Temperature controlled enclosure with temperature gradient <0.1 °C
- Graphic representation of temperature variations

Objective IEC -4-5
Imunity tests. Lighting equipment testing for surges in the mains power supply caused by switching or lightning.
Installation for testing lighting fixtures at voltage impulses according to the standard SR EN 61000-4-5:2015
- Power supply 230Vac/50Hz
- Maximum impulse voltage 13.5 kV
- Minimum impulse voltage 50 V
- Pulse amplitude measurement accuracy<10%
- Maximum impulse current 6kA
- Pulse duration 1.2/50 μsec and 8/20 μsec
- Pulse duration accuracy <15%
Disturbances in the power system
Equipment powered from the low voltage network is subject to voltage shock waves caused by switching or lightning. The main disturbances in the allocation system can be caused by:
- switching capacitor banks
- load changes in the electricity distribution system
- resonant circuits associated with switching devices such as thyristors
- various faults in the cm system such as short circuit and faults in the earthing system of the installation
- direct lightning to external circuits and which inject large currents and produce high voltages
- indirect lightning strikes (between or within nearby objects that produce electromagnetic fields) that induce voltages/currents on conductors outside and/inside a building.
Street lighting performance


The quality of road lighting is an important aspect of traffic safety on public roads. For the complex evaluation of illuminated scenes, it is necessary to know the luminance distribution in the entire visual field or at least in a large number of its segments. Therefore, to perform measurement tasks using a point-to-point measurement technique, it takes an enormous amount of time and can only be done in a coarse mesh or is impossible.

The development of CCD camera photometers has made it possible to solve several measurement problems, such as measurements for UGR blindness assessment, night vision conditions analysis, assessment of brightness sources, etc..
The measurement results are conditioned by the quality of the road surface, weather conditions, buildings along the road, ambient lighting, etc.


Emergency signage performance


Emergency indicators are important components of modern fire protection systems in buildings.
They should be visible through the smoke and thus guide the evacuation of the occupants.
Well-designed and properly installed emergency exit signs are essential to the effectiveness of emergency exits and compliance with relevant standards and codes (fire, building, health and safety).


Luminance
Known as photometric brightness, luminance is a measure of the flux emitted by or reflected from a relatively flat and uniform surface. Luminance can be considered as light intensity per unit area. The unit is candelas per square meter (cd/m).
Luminance contrast
Luminance contrast quantifies the perceived brightness of an object relative to its background. For an output sign, the relevant contrast is between the luminance of the letters / icon (caption) and the luminance of the rest of the sign face (background).


Information
Temperature measurement by the non-contact method (electrical)
By combining high-speed sampling digital multimeters and high-precision fast-pulse current sources, the junction temperature in multi-LED circuits can be measured. The results allow to calculate the thermal resistance in the mentioned conditions. The Electronic Industry Association EIA / JEDEC JESD51-1 describes the “Electrical Test Method”, a junction temperature measurement technique based on direct voltage measurement for diode testing. This method uses two levels of current: a measuring current, a low level, and a high-current heating current. The measuring current level is large enough to ensure the diode conduction state, but sufficiently low to not produce significant self-heating, typically several tens of milliamps. For LEDs, the heating current is usually chosen to be nearly the same as the operating current – hundreds of milliamps or amps.
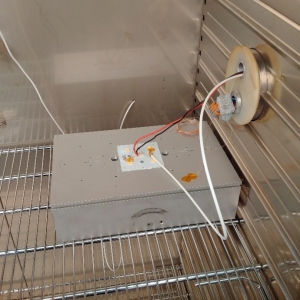
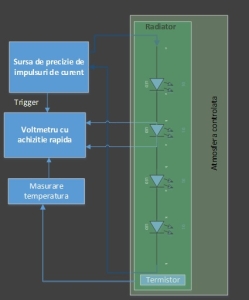 Example of a junction temperature measurement circuitry in a luminaire with separate power supply together with measuring instruments. The tested device has LEDs in series, mounted on a heatsink in order to remove heat. In this example, the junction temperature is measured from a single LED in the array, and the thermal resistance (Rθ) of the junction is calculated.
In the test method, the variation of the forward voltage (Vf) with respect to temperature is first determined by supplying the LED with the measuring current and varying the temperature. The resulting points are graphically represented and the relationship is reduced to a single slope factor, called the K factor: K = ΔVf / ΔT
For single LEDs, K ranges from 1 to 3 mV / ° C. Using this factor, a change in LED junction temperature can be calculated by measuring the corresponding change of voltage Vf and division by K: ΔT = ΔVf / K
The electrical test method specifies a dynamic technique for measuring the junction temperature (Tj) under high-current heating conditions. The LED is powered by a large heating current for a period of time and then quickly switched to the low current. Vf is measured immediately after switching to the low current and compared with the measured Vf voltage before applying the heating current. Using the above equation, ΔT is obtained and added at the temperature of the known case (Tcase) of the LED to obtain the actual junction temperature: Tj = Tcase + ΔVf / K
 Although the test method is quite simple, implementation in LED lighting circuits presents significant challenges for both the pulse source and the measuring instruments. The pulse source must provide fast and precise high intensity pulses in a power circuit containing cables and then quickly return to low current levels to allow for junction polarization stresses. Impulse currents up to 10A and voltages of hundreds of volts are typical values. As for small currents, there are three to five orders of magnitude below these levels. Similarly, the measuring instrument must rapidly acquire voltage values, typically up to 200 V, to accurately measure millivolts in tens of microseconds at each trigger.

These requirements are met by customized measurement and data acquisition systems, therefore pulse sources are dedicated to this type of test. The characteristics of these specialized equipment are not met by most measuring instruments, usually used for this type of measurement.
Contact
Laboratory of Photometry and Electromagnetic Compatibility
LFCEM – Electromagnetica SA
Contact person: Matei Stelian
E-mail: stelian.matei@electromagnetica.ro
Adress: Calea Rahovei, 266-268, sector 5, București
Phone: 021 404 2146
Fax: 021 404 2148
Accredited laboratory according to SR EN ISO/CEI 17025
Produces and manufactures LED lighting fixtures and systems